last updated: 10/30/14, 10/29/14
NYC Property Transaction Extractor
I made some progress on the backend of the app which uses Node JS with the Express framework, Jade and Postgres with PostGIS. Now a user can draw a rectangle or a simple polygon on the map and tax lots will be returned from the Postgres database for the selected area.
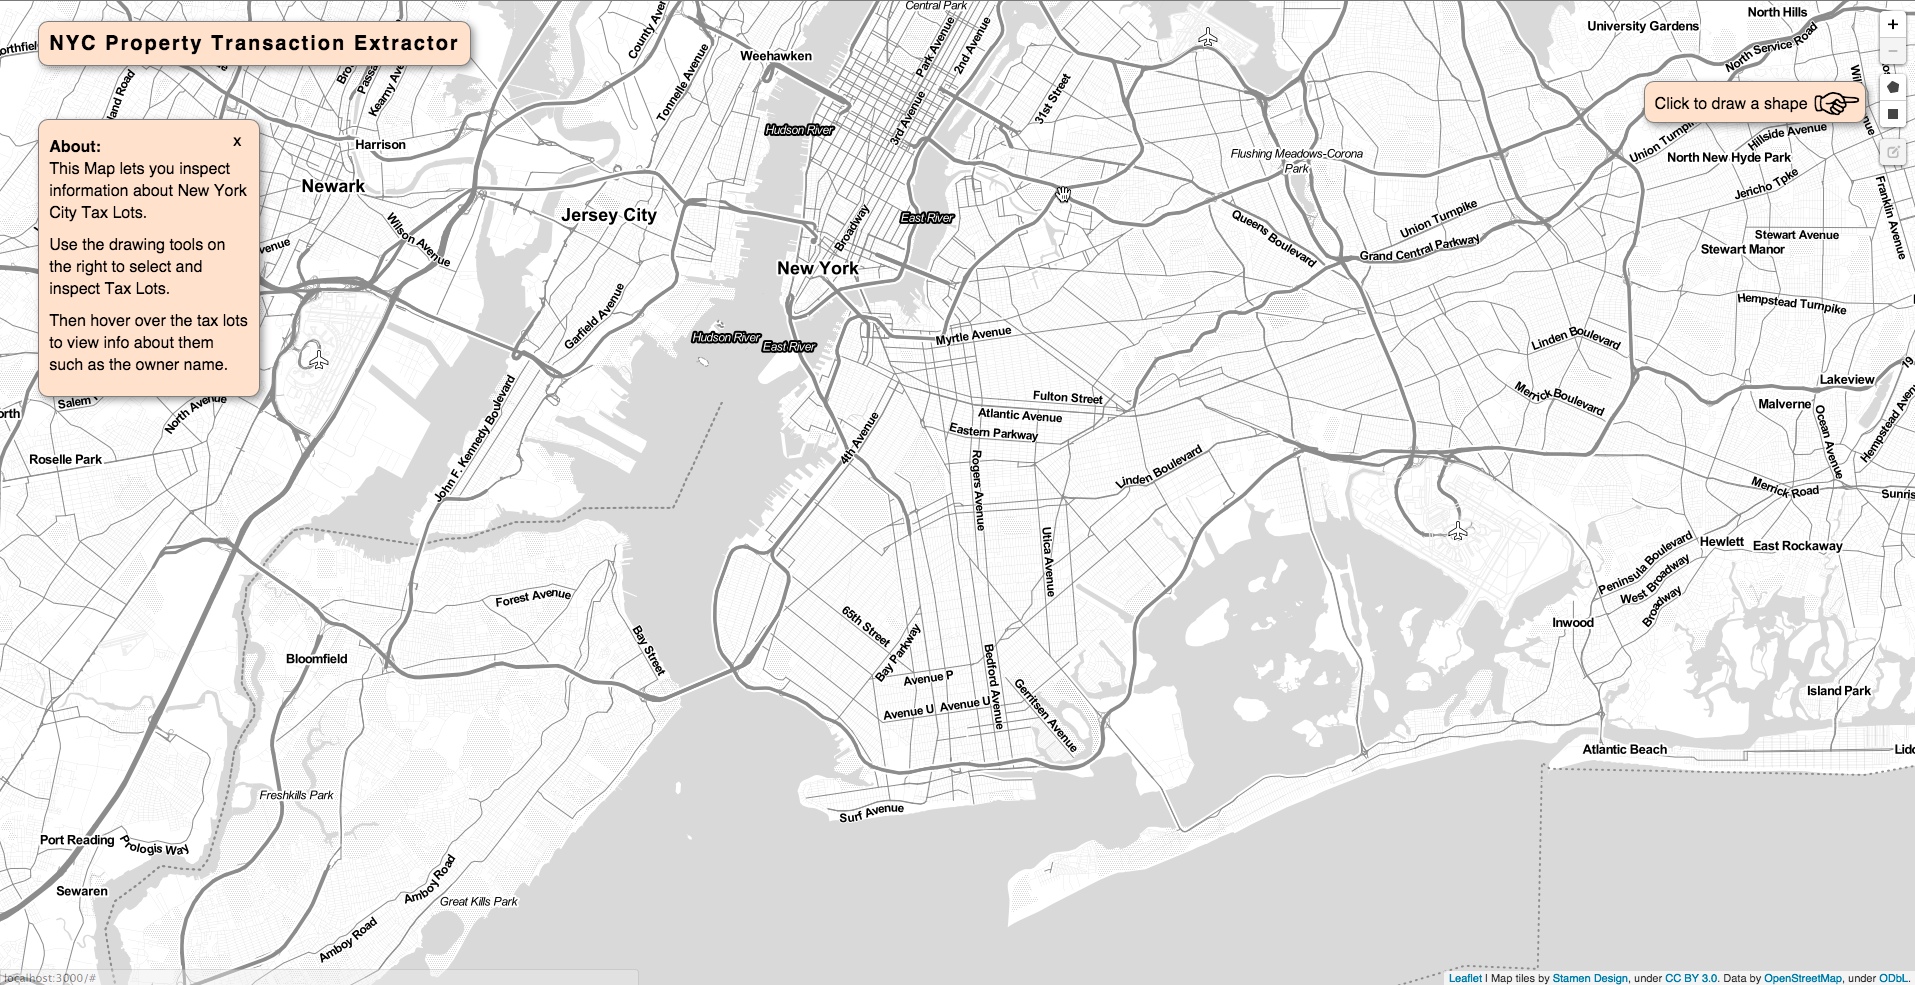 the view of the map when opening the page
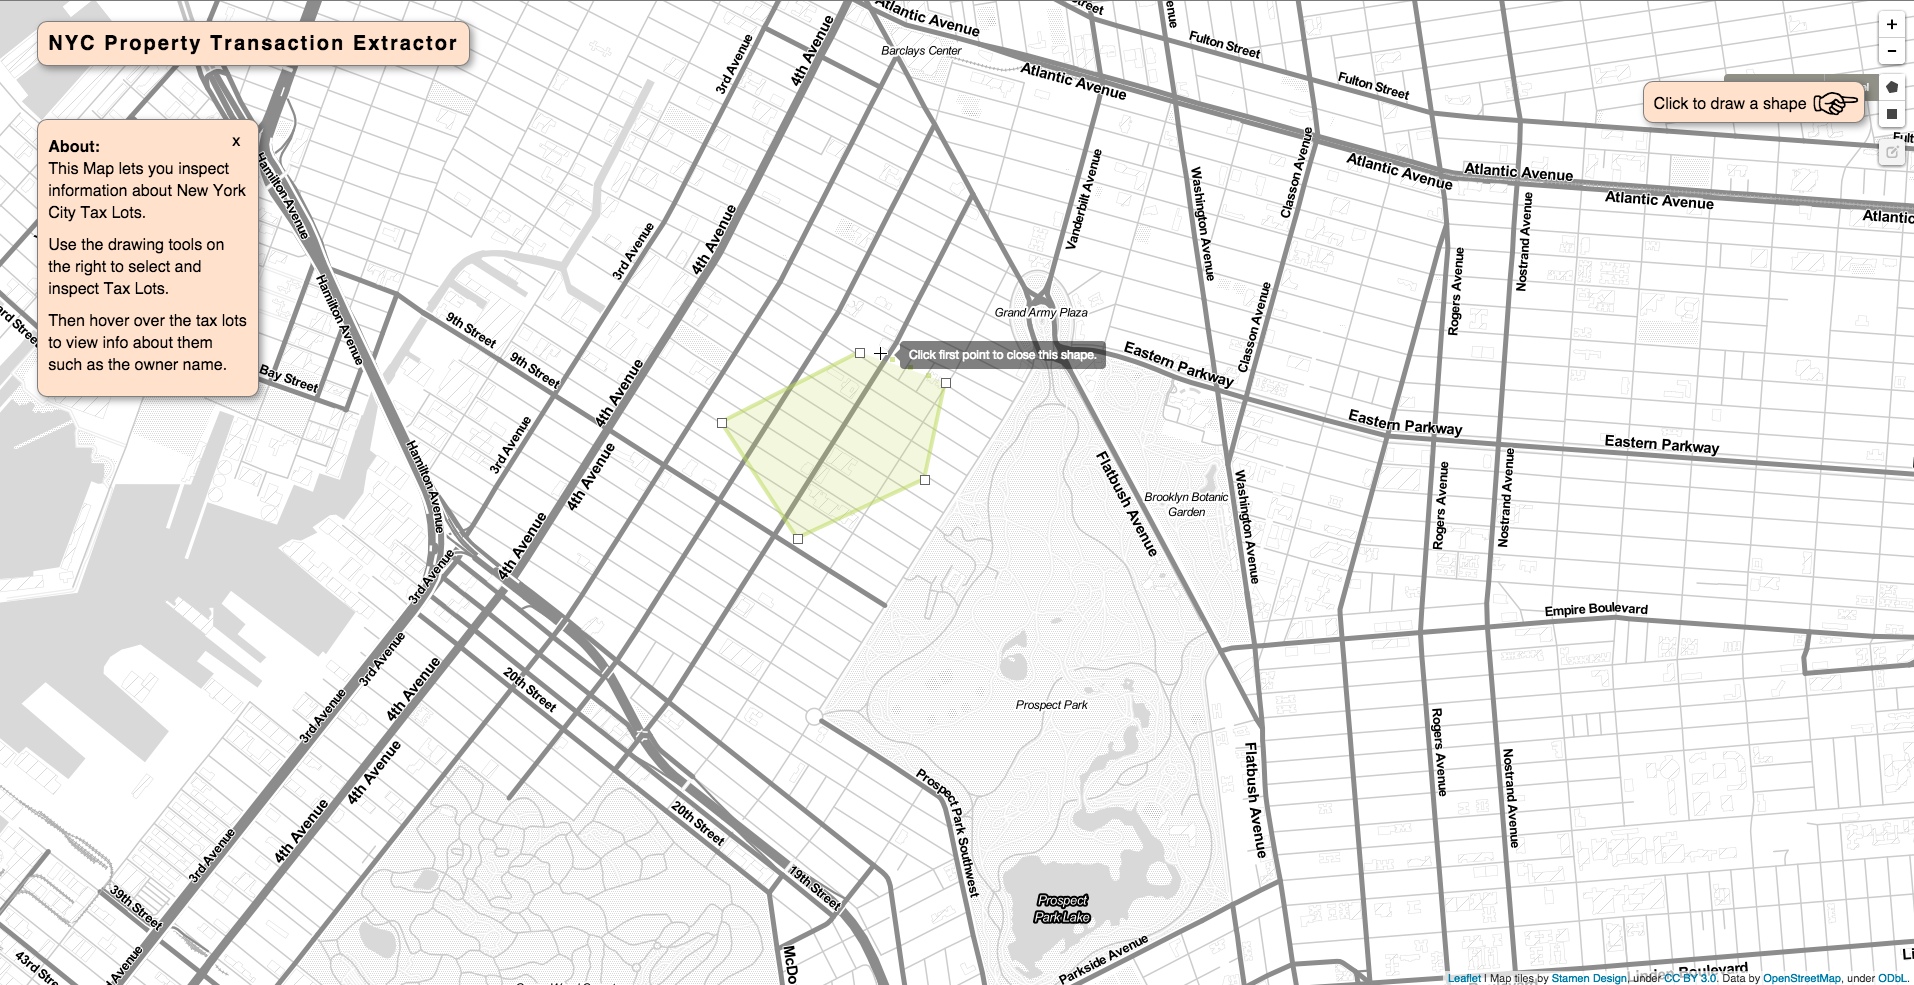 zooming in and selecting an area by drawing a rectangle
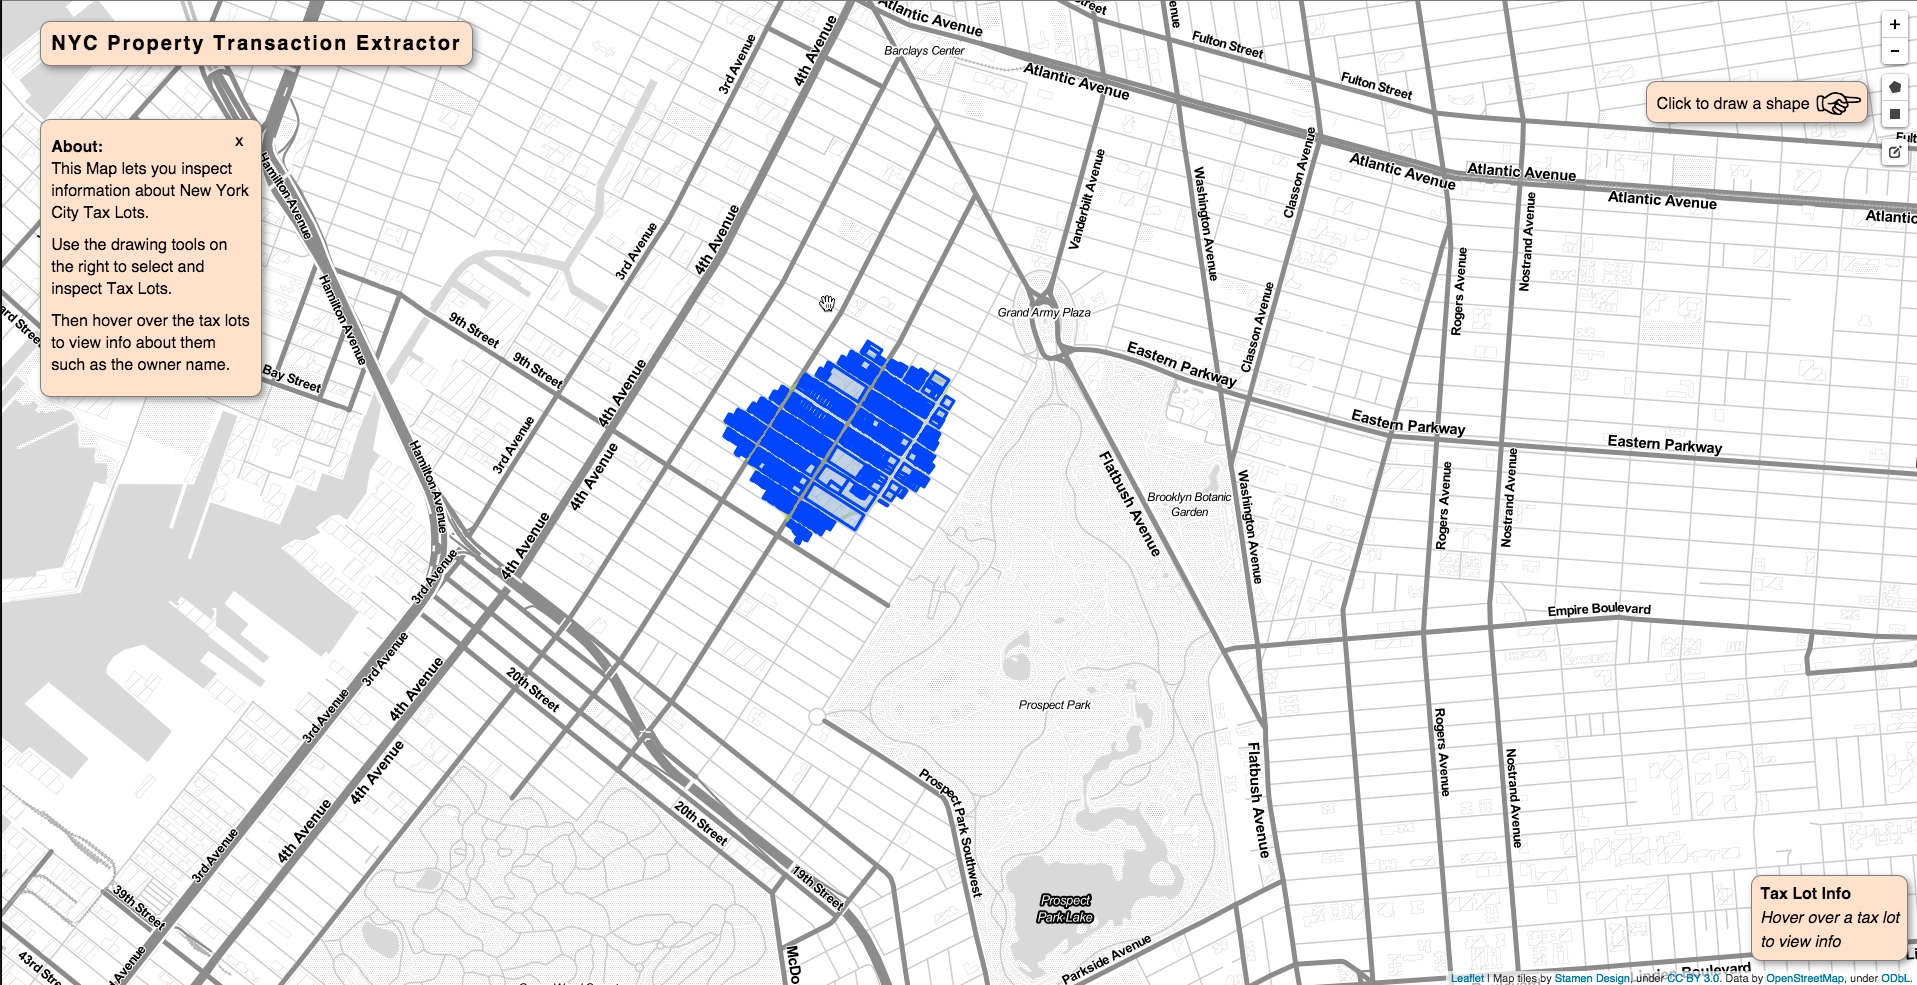 tax lot data returned from the database for the selcted area.
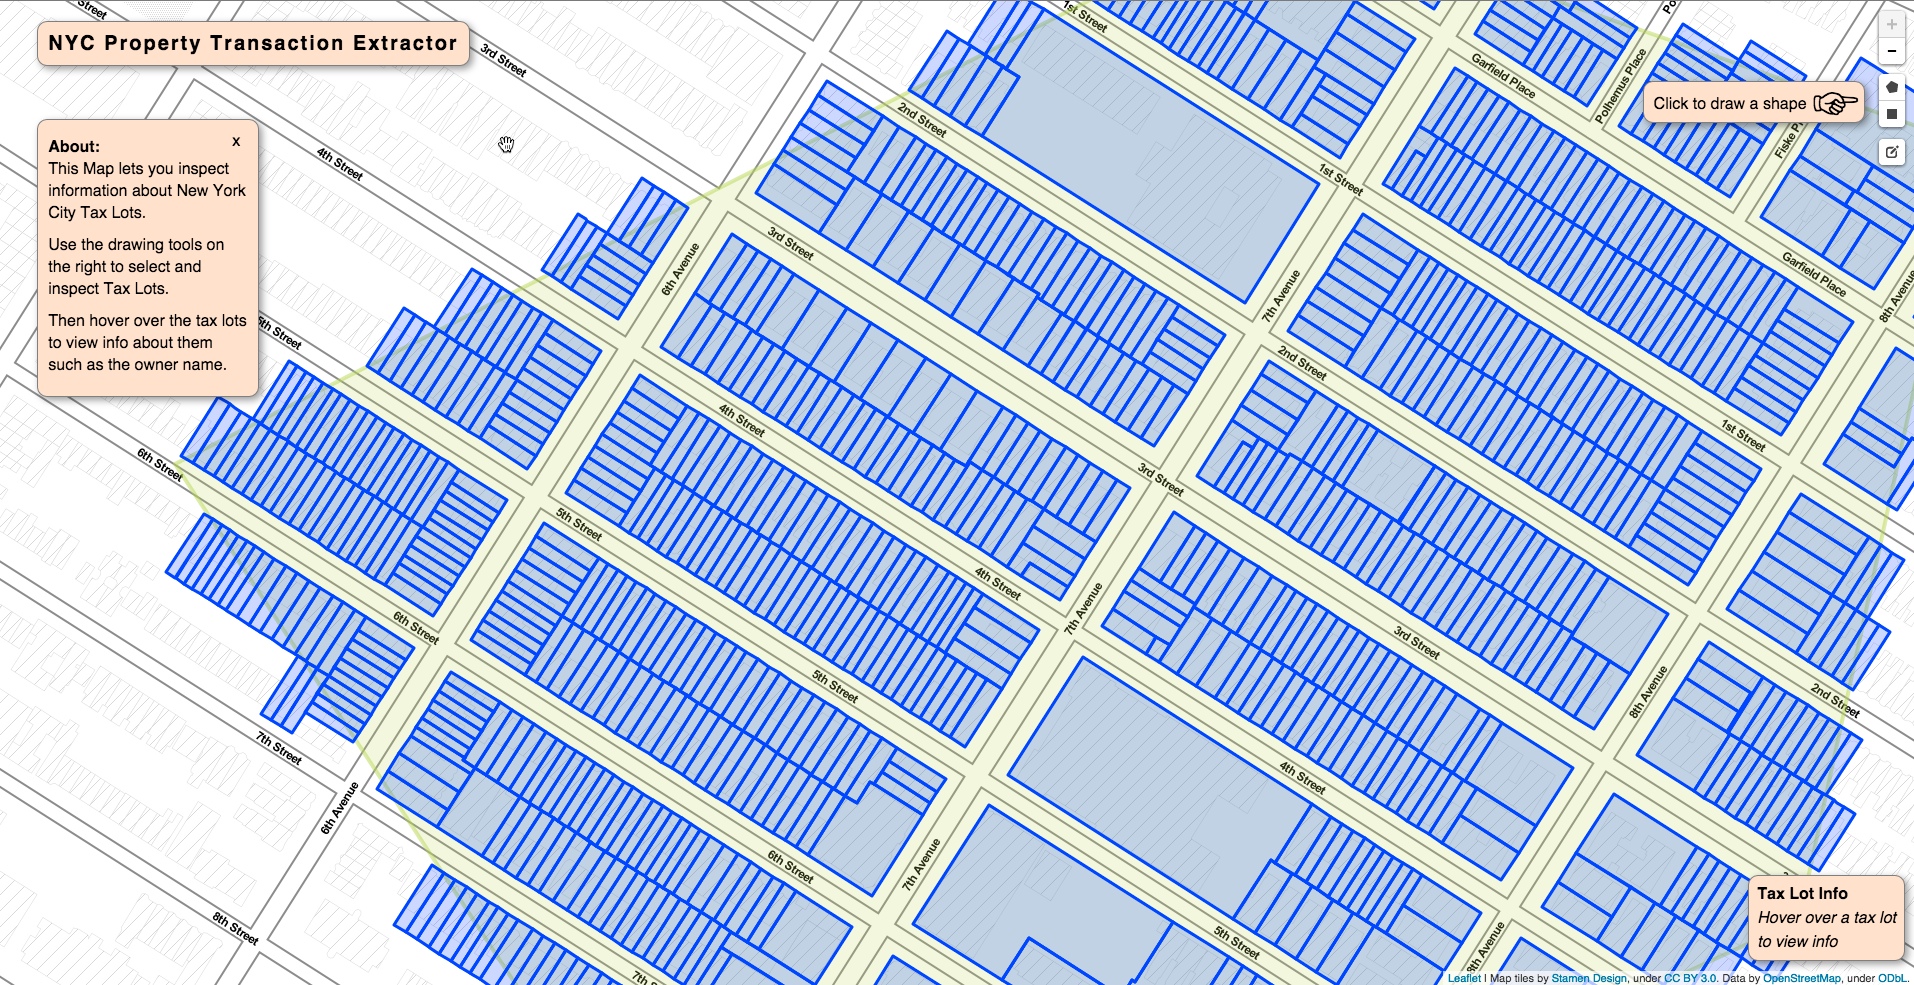 zooming in to the selected data
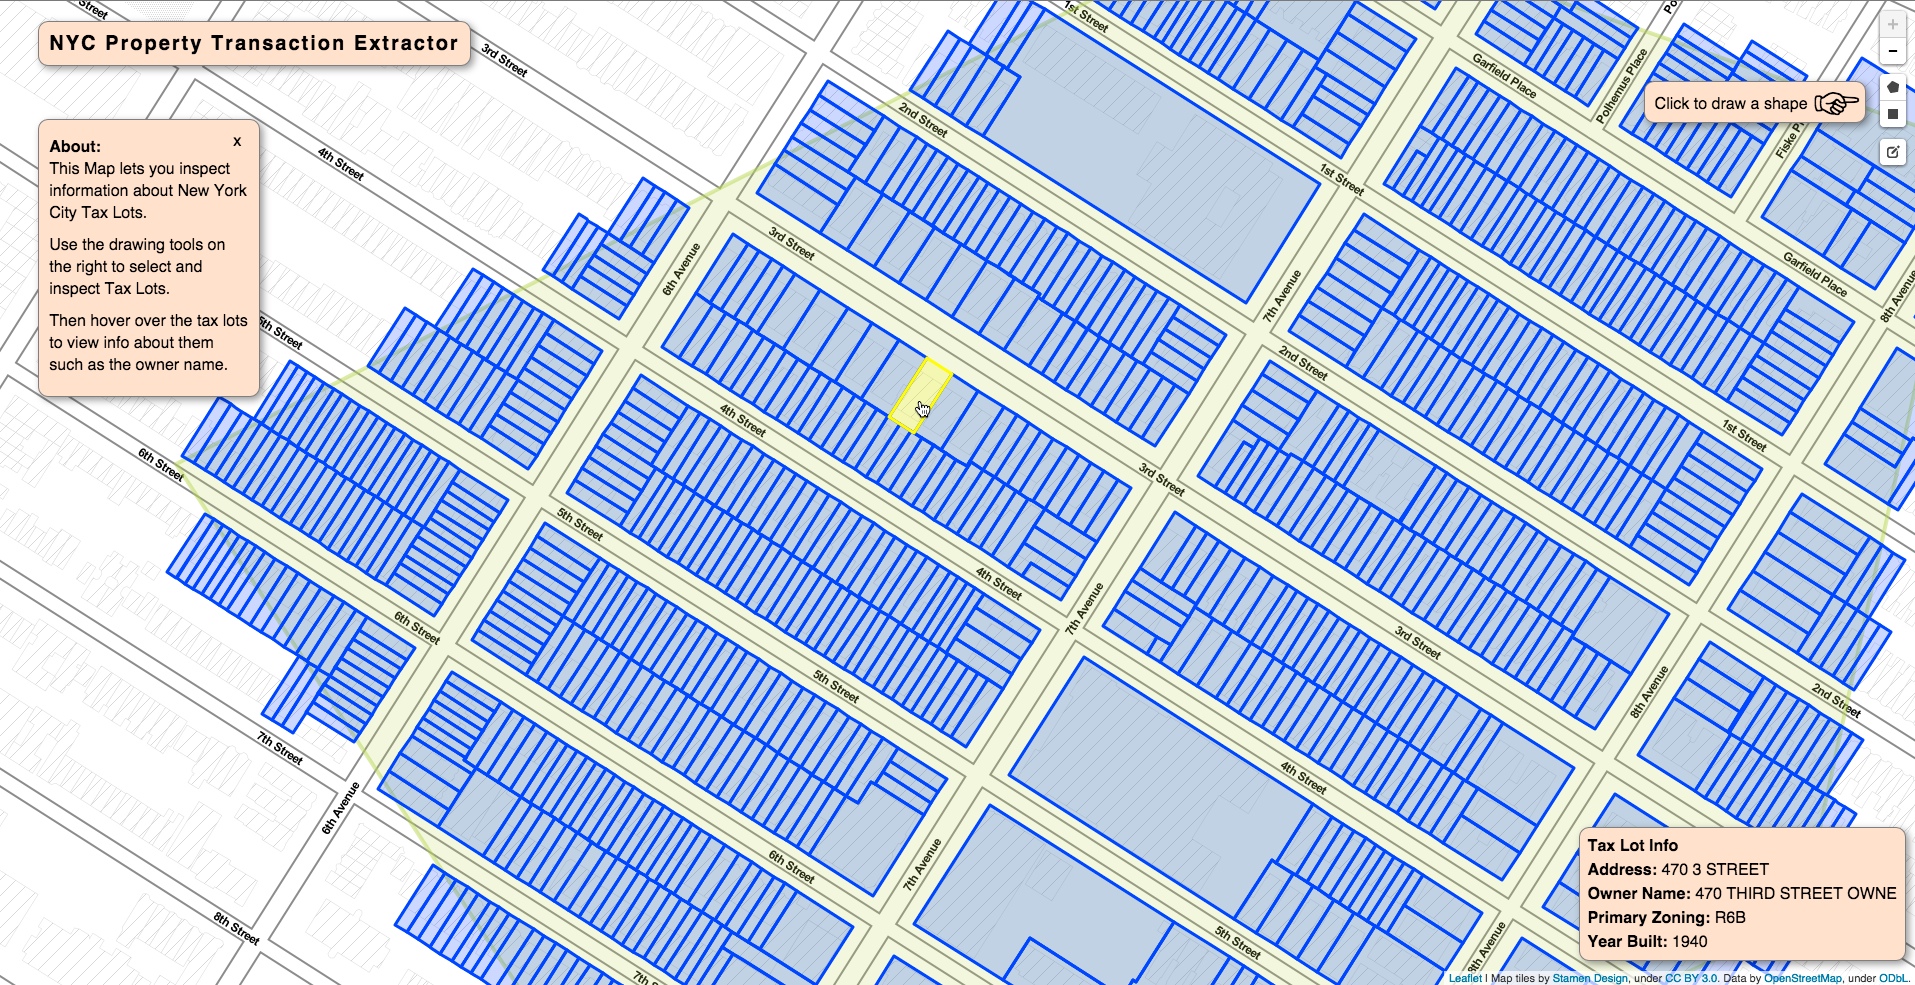 hovering over a tax lot reveals information such as its address, owner name, year built and primary zoning.
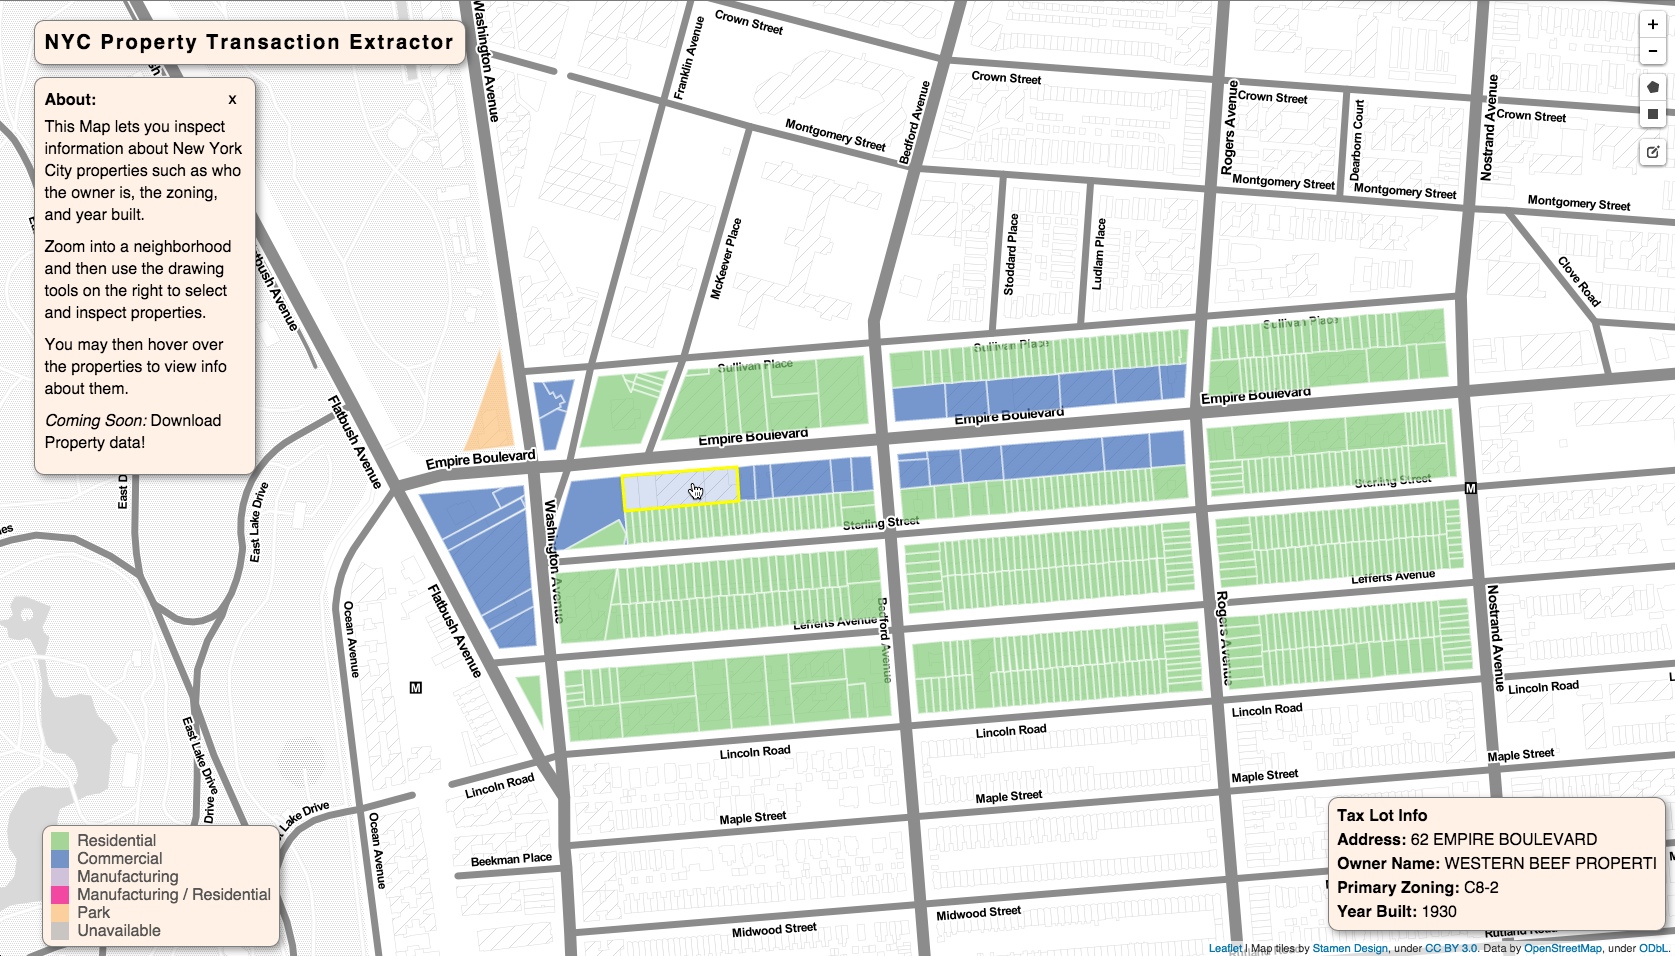 adding color coding with a legend based on a lot’s primary zoning.
Critique Feedback:
From the multi studio group critique on 10/30/14 some interesting ideas came up.
In terms of improving the app allowing the user to apply filters for returning types of data could be helpful. For example selecting only certiain zoning types, range for year built, etc. Another was that a search bar could be added for people to search by address or neighborhood (yay geocoding!).
As I’ve decided to move away from making an app to making a more narrative site for my thesis a number of other interesting ideas were suggested:
-
creating a website that appears to be an app in order to decieve developers and real estate speculators. There are a number of interesting directions this could go such as when the user looks for property data they get back a story about someone being displaced.
-
Crowd sourcing narratives of people who have been priced out of their apartments or have found it increasingly unaffordable to live in the city.
-
Using the Leaflet Draw tool as a way to explore the narrative. Perhaps by selecting a neighborhood or by drawing paths, shapes and points to submit as part of the story.
-
Anzeka suggested looking at a report put out by the NY comptroller that was a survey on the affordability of housing in the State.
-
Common Ground; a non-profit who’s mission is to buy a building and rent it out as completely affordable would be worth talking to.
-
Looking into the mis-management of vacant & abandoned buildings which could be homesteaded.
-
Criticizing Deblasio’s affordable housing plan. Part of it includes pushing for more Section 8 vouchers yet who will build the units that will be open to renting to section 8 tenants?
-
Submitting a FOIL request for eviction data from the Department of Homeless Services.
To Do:
Refine the UI:
- add some elements that explain purpose of the site and how to use it. This might be an interactive guided tour of the site.
Develop Further Interaction
- user selects area with drawing tools
- add a UX caveat: they must be at a zoom level > x so they don’t select too much data and bog down the map or server.
- tax lots are displayed with mouse hover interaction.
Next Steps:
-
user is asked to confirm selection. Meanwhile they can hover over lots to explore their properties (refine this?)
-
when user hits a submit button the ACRIS transaction histories are queried for each lot
- CSV files are generated, zipped and sent to user’s browser for download.
- perhaps the user gets an email when this step is complete with a link to dl if it takes too long?
- last but not least host on AWS or Heroku!